Bedford School Homepage Our Latest Field Trip Blogs Follow Us On Twitter Read The Bedford Geographical Newspaper Follow The Global Issues Blog by our A2 Students
Showing posts with label guerrilla geography. Show all posts

Saturday, 5 October 2013

Open Day Guerilla Investigation

Hypothesis:
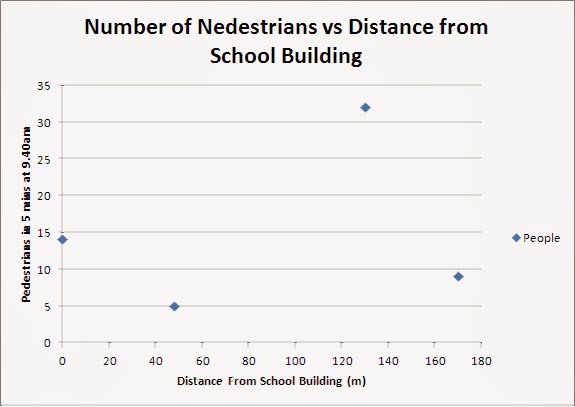
There will be more pedestrian activity closest to the main school building.

Method:
Synchronised 5 min pedestrian count at 9.40am at varying distances from school.
Pragmatically sampled at locations known to be on the tour path.
Graphical Evidence of what location looks like.

Results:

Scatter Graph of Pedestrians vs Distance

Interactive Map of Results (click on Green Pins for Results)

View Larger Map

Analysis
There is no clear correlation of results. The centre of school was only the second highest result. However, being near the car park means we could remove the top result as an anomaly. It is more than twice the size of the next largest result. If this was removed, the centre of school would be the highest result, but from a set of 3 points.

Therefore, we cannot support our hypothesis with this data. If we include the car park result, then we can actually disprove it.

Evaluation
We only took a 5 minute period early on the Open day, at only 4 locations. This did not allow us an even spread of the school site and removes the temporal factor that may see pockets of people ebb and flow at sites during a day.

Saturday, 1 December 2012

How has recent weather affected our school?

Year 12 pupils had a lesson to collect and then contribute to a map of the effects of the recent bad weather on our school community.

The video below shows the storm patterns on the 24th and 25th which began to flood the river and saturate the soil. this was compounded by further rain on the 26th, 27th and 28th and then frost on the 30th and 1st of December.


The map below should interactively show the observations. Click on a placemark to see the observations and some images. There is more to come soon as well.
There is also one placemark 11km North West of the school in Harrold referring to the bridge being blocked. The rain clouds west of the school show weather data from the last two weeks.


View Larger Map

Wednesday, 17 October 2012

Guerrilla Geography at School Site - results

As published last week, open day at the school inspired a study by year 12 students to see whether the perceived status or value of cars influenced their location. When collecting the data, it had appeared that smarter cars located closer to the most visible and walked past locations on the school site. The location of the cars was mapped out in the field then transferred to a map in the classroom. The map includes a key where the colour denotes the car type. Note that the tabular form of the key allows an easy analysis at first glance of car types and their proximity to what was deemed to be the highest exposure site: immediately next to the South porch, the main entrance for the day.

Click on the images below to see them clearly and on a larger scale.


Fig 1: Map showing the locations of car types and the prime location (marked by an X)

The students have also graphed the number of each car located within 50 metre intervals of the prime location:

Fig 2: Bar graph of 50m wide radii of location and brands within them

So... do the cars that are better locate closer to important locations, and do those that are worse hid further away?

From the map, the closest cars to the prime location are Vauxhall, Audi and Lexus. The degree to which this can support any theory depends on which model. Certainly those spotted on the day appeared smarter. Within 50m there are also pockets of BMWs and VWs. So, though there are smarter cars close to the most visible location, there is no dominance by any particular brand.

The key on the map gives some more revealing information however, when the proportion of each car in each circular band is given. Audi, BMW, Lexus, Vauxhall and Mercedis all show a tendency to locate closer to the most visible location, whilst Ford, VW and Range Rover are skewed the other way.

The graph, displays some interesting trends too. The most notable bars are those for the Audis within 50m and the Fords between 150 and 200m. There are brands which  havn't located within the 150m-200m category at all: High range BMWs, Jaguar and Lexus, whilst some have not located within 50 metres: Honda and medium range BMWs.

Some data needs no analysis since it is likely that Jaguar and Porsche drivers will locate wherever they like!

Overall, the data probably supports the initial theory that drivers of nicer cars locate closer to the most visible locations, although it would appear that the visual study at first may have carried an emphasis on those cars which were more striking since the spread of cars is greater than was first anticipated. being able to investigate and quantify Geographical observations has been a very useful exercise, as has using different forms of presentation to highlight certain data more clearly. We are on the lookout for more small scale investigations around us...


Saturday, 6 October 2012

Guerrilla Geography on the school Site

Open day at school inspired an impromptu semi-guerrilla investigation.
It was noted that those cars which one would perceive to be more expensive or more coveted were parked in positions of greater prominence.

Year 12 boys have collected maps of the car locations which will be presented and analysed this week.


Prius located away from traffic around natural surroundings!


Most prominent position - front of school


Scho car park, a less desirable location???

Posted using BlogPress from my iPhone